REGIONAL HOUSING SUPPLY / DEMAND AND OVER / UNDER VALUATION PATTERNS AND 5-YEAR FORECASTS
Housing Supply and Demand Trends and Forecasts
The following housing demand model generated from our economic database, presents our housing supply/demand estimates and forecasts In general, the patterns of over supply and under supply are based on a comparison between a given year’s ratio between jobs and housing relative to the long-term trend. As shown, the table presents patterns in housing over-supply and under-supply in this region since 1990, with a forecast to 2014.
The model accurately measures significant levels of distressed inventory which are likely to peak during the next 24 months, followed thereafter by a trend toward under-supply, which is likely to first occur during 2014, with the market showing tightness in 2013. Under-supply is likely to be significant after 2014.
Demand and supply estimates represent the total number of houses demanded and supplied in this particular region. The current year reflects over-supply which will likely worsen during the next 24 months before improving, then reaching equilibrium in 2013. Thereafter, another cycle of under-supply is likely to form as the economy continues to expand in an atmosphere of relatively low housing supply. Oversupply (mainly caused by distressed housing and over building during the past several years) will cause continued, but more conservative, depreciation in the current year, followed by low rates of price appreciation during the next few years. Periods of oversupply should be followed by increasing levels of undersupply as the economy begins to expand and as incremental housing supply remains very low.
It should be noted that patterns in oversupply or undersupply do not fully describe the health of the overall housing market. Absorption of housing can be strong in an atmosphere of over supply and under valuation. In order to more fully understand market health, patterns in over and under valuation must be understood. Historical and forecast median home prices are compared with our modeled estimates of supportable median home prices since 1990. Similar to our over/under supply analysis presented in the previous section, differences between our modeled estimate of supportable median home prices and actual median home prices offer measures of over-valuation or under-valuation since 1990, with forecasts during the next five years.
Our model accurately reflected serious levels of over valuation which occurred from 2005 through much of 2008. Significant drops in price during 2008, and continuing into 2009, have caused current levels of unprecedented under valuation, which have been magnified by historically low fixed mortgage rates. It must be stressed that if rates jump, the unprecedented level of under valuation would disappear. Given our forecasts for rising mortgage rates and eventual mild price appreciation, levels of under-valuation are likely to recede fairly gradually, with equilibrium forecast to appear by early 2013.
These patterns suggest that the ideal time for housing purchases and residential land purchases in this particular region is during the next 12 to 24 months. Thereafter, strong values will continue, but at a diminishing rate. Never before have housing values been so strong in this region – reflective of a severe recession, but even more reflective of the impact of extremely tight credit and artificially low mortgage rates. For those households that are secure in their jobs and can purchase a home with a fixed rate mortgage, there may never be a better opportunity in this area.
View other Areas
Overall Market Forecast
Our analysis of both housing supply and demand patterns, and housing over/under valuation is merged into a composite index that Real Estate Economics refers to as the Market Opportunity/Risk Index as presented in Exhibit D. This index includes jobs-to-housing relationships and mortgage cost-to-income relationships.
It must be stressed that the Opportunity/Risk Index tends to lead market changes by as much as 24 months. For example, as the composite index began to fall significantly below equilibrium in late 2005, it correctly predicted market troubles which first became apparent by late 2007. The index formed a floor during 2006, translating to the worst part of the real estate cycle being felt during 2008-09. The index reached and began surpassing equilibrium mid-2008, but the resultant market stability is not likely to be manifest until mid-2010.
Similarly, the high level that the index has currently reached during the 1st half of 2009 will not likely be manifest in the market until the 1st half of 2011. If relationships between this index and actual market manifestation holds true, overall market conditions should improve dramatically during 2011 from current levels. Prices will remain flat in 2010, followed by mild appreciation which will become increasingly apparent as more households recognize the severe under valuation of housing in this market area, and as the economy resumes expansion.
View other Areas
Regional Summary
With Federal Reserve Chairman Ben Bernanke’s recent announcement that the national recession is likely over, it appears that the Seattle-Bellevue-Everett, WA MSA will be among those regions lagging the recovery. This region, however, did not suffer a downturn nearly as severe as the downturns felt in California, Arizona, Nevada and other over heated and over inflated markets. Nonetheless, the Seattle region’s downturn has been painful. Having suffered through one of its biggest downturns in labor and housing in years, the region’s housing market will not fully stabilize until Year 2011.
High and increasing levels of distressed housing supply will continue in the near-term, but as distressed housing inventory continues to fall in price, sales volume will increase beyond foreclosure volume, soon beginning to burn off distressed inventory has built up over the past two years. New home builder market share will remain low because very few new homes are being built, but the few new home communities that are introduced during the next few years should sell readily during and after Year 2011 if offered at prevailing market price lines. Historic under valuation will be followed by price appreciation once economic growth emerges, which will likely begin in 2011, setting the stage for improved housing market conditions as the economy begins to expand.
View other Areas
Wednesday, March 3, 2010
Wednesday, December 9, 2009
Sustaining Economic Recovery and Stabilizing Consumer Spending
Evidence is beginning to develop that, despite the seriousness of the recession; household balance sheets can be stabilized, particularly as the employment picture improves in coming years. Improving household financial conditions will be vital to initiating and sustaining an economic recovery and stabilizing consumer spending, particularly on housing.
Initial evidence of initial improvement can be seen in the total mortgage obligations of American households. Total mortgage payments by U.S. households, from the Bureau of Economic Analysis are shown below.
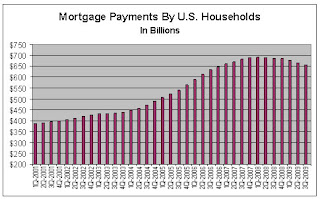
The aggregate payments shown above can be reduced by a number of factors including the lowering of weighted interest rates which has occurred in recent months. Foreclosure, whether caused by loss of employment or by strategic choice, will also act to reduce the outstanding loan balances over time. Selling a vacation home, a short sale or forced foreclosure all act to reduce the aggregate payments made by households. Given the amount of time it is currently taking to process a foreclosure, the decline in payments data is clearly a lagging indicator and acceleration in the decline in payments is presumably already taking place.
Even if a new mortgage is originated from the sale of a foreclosed unit the loan balances is likely to be far lower than the balance of the previous owner, particularly when previous junior liens are considered. Thus the payments picture is likely to improve even as distressed inventory is absorbed.
Magnifying the improving trend in payments is data from the multi-family sector that suggests many senior citizens, college students and “boomerang” young adults are returning to the primary household to economize. This suggests an increasing ability, over time, of households to maintain at least one “core” family residence, family-owned or not.
The elimination of an oversized house payment from the household budget or an increase in the household income generated by adding additional income sources have the potential to rehabilitate a household balance sheet. A more challenging proposition will likely be convincing the family that buying a home in the future will present a “good” investment and viable financial step.
John Mulville
Real Estate Economics
http://www.realestateeconomics.com
HOUSING RECOVERY FORECAST – SOUTHERN CALIFORNIA
Hi,
The state budget deficit has intensified record high unemployment levels, slowing the housing recovery in Southern California. However, the worst may be over for housing. Strong depreciation has stimulated strong demand for bargain priced properties, leading to historic under valuation for housing in Southern California as seen in the following Opportunity / Risk Index:
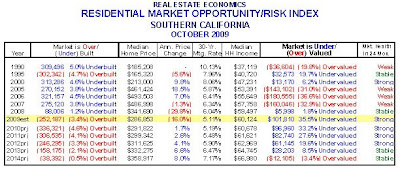
This index factors the keys indicators of jobs-to-housing and mortgage cost-to-income relationships in order to define housing market health and forecast the housing recovery in Southern California. Despite the loss of housing values and high level of price over correction, mild price appreciation will not resume until economic growth emerges, which will not likely occur until the latter part of 2010/early 2011.
Overall market conditions should improve significantly during 2011 as the economy begins to expand, lending restrictions begin to ease, and increasing numbers of potential buyers recognize the historically strong housing values.
Mark Boud
http://www.realestateeconomics.com/
The state budget deficit has intensified record high unemployment levels, slowing the housing recovery in Southern California. However, the worst may be over for housing. Strong depreciation has stimulated strong demand for bargain priced properties, leading to historic under valuation for housing in Southern California as seen in the following Opportunity / Risk Index:
This index factors the keys indicators of jobs-to-housing and mortgage cost-to-income relationships in order to define housing market health and forecast the housing recovery in Southern California. Despite the loss of housing values and high level of price over correction, mild price appreciation will not resume until economic growth emerges, which will not likely occur until the latter part of 2010/early 2011.
Overall market conditions should improve significantly during 2011 as the economy begins to expand, lending restrictions begin to ease, and increasing numbers of potential buyers recognize the historically strong housing values.
Mark Boud
http://www.realestateeconomics.com/
Subscribe to:
Posts (Atom)
